Monitoring sea and lake ice
- Department Image analysis and Earth observation
- Fields involved Earth observation
We have developed methods for automated monitoring of sea and lake ice to assess properties such as surface temperature and ice thickness. Monitoring is important for navigation purposes, climate change observation and public safety.
Understanding the extent and properties of the ice
In northern latitudes, sea and lake ice are common environmental features during the winter season. Monitoring the extent and properties of sea ice is important to ensure safe navigation in ice-infested waters. Lake ice is closely watched to ensure public safety as there are numerous reports of individuals falling through the ice every year. Furthermore, assessing the ice is crucial for understanding the ecosystem. Freezing is intricately linked to a lake’s annual turnover, and temporal changes in our seas and lakes serve as important indicators of climate change.
Typically, sea and lake ice has been monitored by ice analysts who manually inspect remote sensing images and, with lakes, photos from nearby cameras. However, these methods are labour intensive and place limitations both on accuracy and volume, restricting the number of lakes that may be monitored at any given time.
Automated retrieval of remote sensing data
Automated retrieval of remote sensing data solves this problem, as data is frequently made available and it enables larger coverage. The spectral information from optical satellite images allows us to extract a range of different parametres related to the state of the ice.
We have extensive experience with automated retrieval of cryospheric variables, particularly from optical images, and we have developed methods for automated monitoring of lake and sea ice in collaboration with various partners. In close dialogue with both user partners and service providers, we have developed algorithms for parametre retrieval that are tailored specifically to their needs. The algorithms are implemented in processing chains that can be included in their operations. In these projects, we used optical satellite images to retrieve various parametres, such as surface temperature, and ice- thickness, extent, and surface type. This was conducted in cooperation with similar retrieval activities pertaining to snow properties.
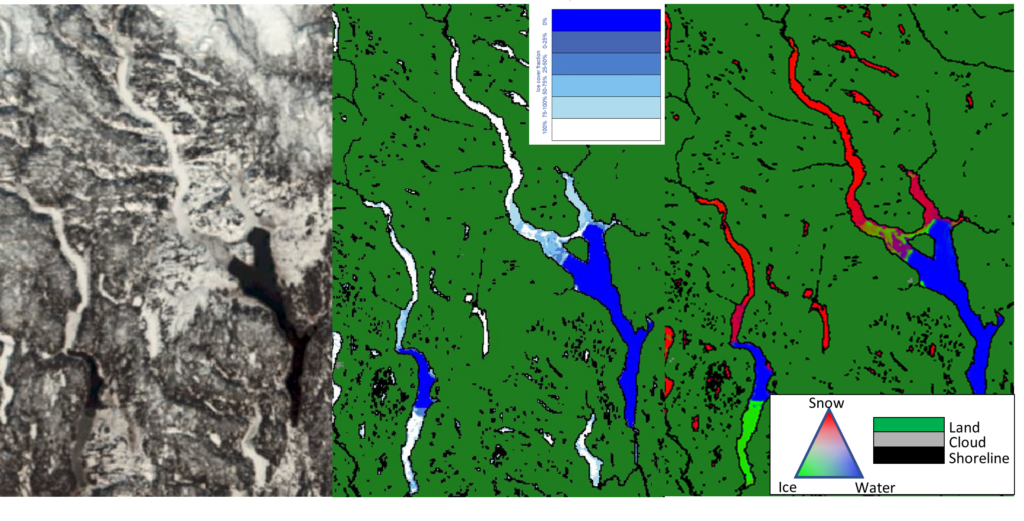
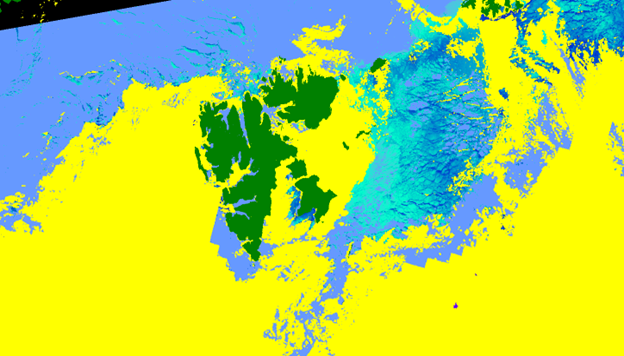
A combination of retrieval and modelling techniques enables us to assess sea ice thickness. We can extract the surface temperature of snow or ice using thermal bands. In modelling the thermal balance, we are able to deduce the heat transfer from water underneath the ice to the surface above, which allows us to estimate ice thickness. We use optical and near-infrared bands to retrieve surface information from various types of lakes. Spectral unmixing allows us to extract specific contributions from different surface types, including ice cover fraction.


Partners and clients:
- The European Commission
- The Norwegian Polar Institute (NPI)
- The Norwegian Meteorological Institute (MET Norway)
- The Norwegian Water Resources and Energy Directorate (NVE)
- The Norwegian Space Agency (NOSA)
Further reading:
Rudjord, Ø., Solberg, R., Spreen, G., & Gerland, S. (2022). Estimating thin ice thickness around Svalbard using MODIS satellite imagery. Geografiska Annaler: Series A, Physical Geography, 104(2), 127–149. https://doi.org/10.1080/04353676.2022.2070158