Using deep neural networks to map wetlands (LAVDAS)
- Department Image analysis and Earth observation
- Fields involved Earth observation, Climate and Environment, Mapping and map revision
- Industries involved Climate and environment
NR is developing deep learning methods for automatic mapping of wetlands in Norway as part of the LAVDAS project.
Our goal is to detect, classify, and delineate wetlands based on satellite imagery and elevation data from airborne laser scanning. This can help reduce impacts on peatlands from land use changes, supporting both climate and biodiversity efforts.
Why is peatland conservation important?
Peatlands are one type of wetland, and one of nature’s most significant carbon sinks.
Disturbing peatlands, for example through construction, causes the peat to dry out and release carbon dioxide (CO₂) into the atmosphere. This contributes to global warming and threatens the distinct biodiversity these ecosystems support.
To prevent further damage, peatlands must be mapped so that developers can avoid them when planning land use changes.
Today, however, mapping is incomplete, especially in areas above the tree line.
Peatlands below and above the tree line
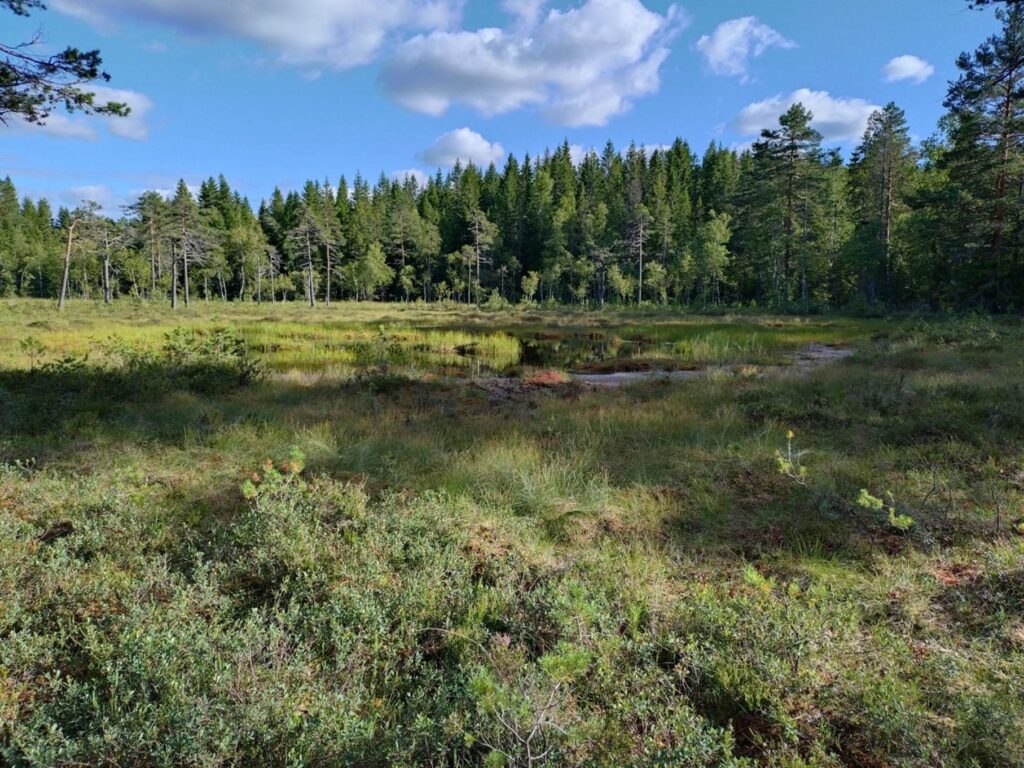
Peatlands below the tree line often have distinct zones: an open centre, scattered trees in the transition area, and dense forest at the edges.
Above the tree line, vegetation patterns are less pronounced, but the species composition changes. This can make automatic mapping more challenging.
Deep neural networks and satellite data
We are testing different types of neural networks to automatically identify wetland areas. The results from our work with U-Net and foundation models are promising.
The models are trained on data from the Sentinel-2 satellite (10-metre spatial resolution), combined with elevation data from airborne laser scanning.
To learn more about this project, please contact:
Project: National Wetlands Geospatial Database (LAVDAS)
Partners: The Norwegian Mapping Authority (project leader), the Norwegian Environment Agency, the Norwegian Institute for Nature Research (NINA), the Norwegian Institute of Bioeconomy Research (NIBIO)
Funding: The Research Council of Norway
Period: 2024 – 2027
Further resources:
Project Bank (forskningsradet.no, external site)
What can satellite data tell us about wetlands?
Sentinel-2 captures both visible light and infrared light —wavelengths humans cannot see. Both provide valuable information.
By analysing these channels, we can, among other things:
- Differentiate between wet peatland areas and drier ground
- Identify differences in vegetation types and activity
- Map moisture levels and detect changes over time
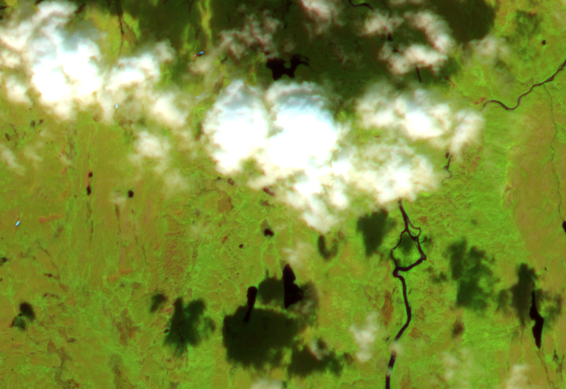
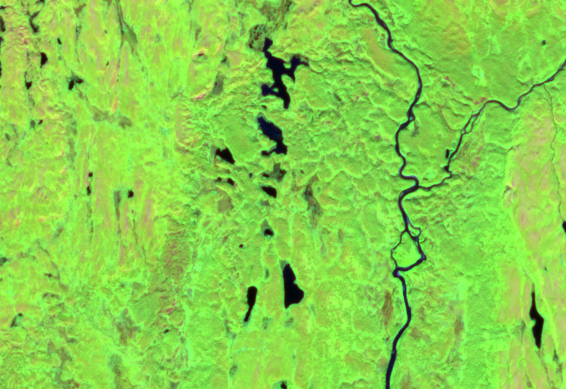
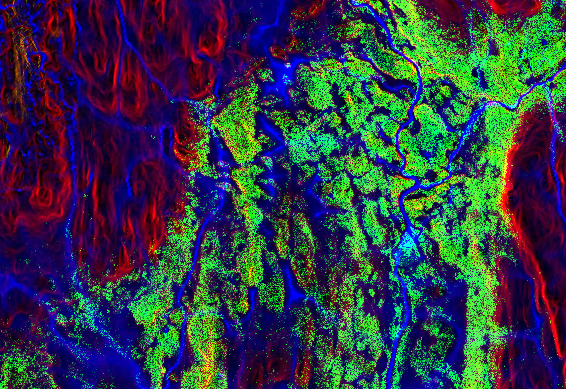
When using satellite imagery, cloud cover is common. To address this, we can either create cloud-free mosaics based on multiple images or combine results from the cloud-free parts of individual images (see figures 2 and 3).
What elevation data can tell us?
Airborne laser scanning provides detailed terrain data. From this, we can calculate, among other things:
- Slope steepness and direction
- Vegetation height
- Topographic wetness index (an estimate of flow patterns and where water is likely to accumulate after rainfall)
Automatic mapping with terrain data and satellite images
The detailed terrain model for Norway is based on laser scanning below the tree line and image matching from overlapping aerial photos in the mountains.
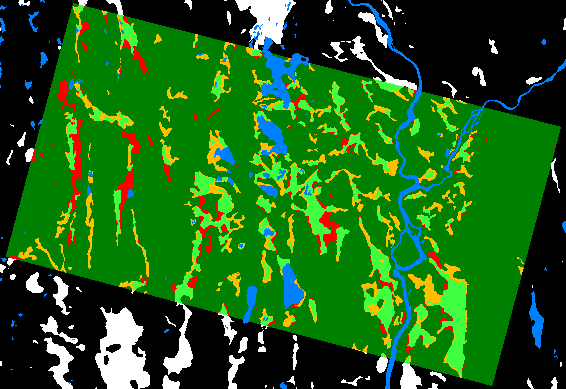
Combined with cloud-free satellite images and terrain indices (slope information, vegetation height, and wetness index), these data form the basis for our automatic mapping method using deep neural networks (see figures 4 and 5).
What do the preliminary results show?
The method currently yields promising but incomplete results.
- 59% of existing peatlands are correctly identified (true positives)
- 41% are missed (false negatives)
- 9% are incorrectly classified as peatlands (false positives)
The results vary depending on the area and data sources. On Finnmarksvidda, in the area around Roancejávri (figure 5), we obtained:
- 55% true positives
- 18% false positives
Using imagery from a single year (2020) leads to reduced performance (figures 6 and 7):
- 25% true positives
- 50% false positives
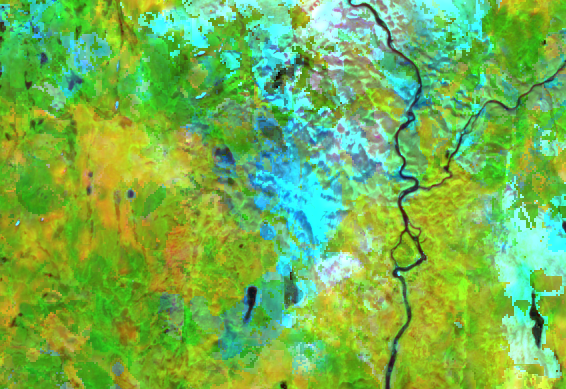
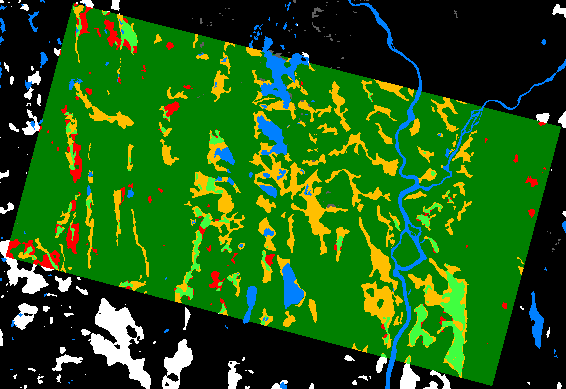
The results highlight the importance of using satellite imagery from multiple years to ensure robust and accurate mapping.
What are our next steps?
We are continuing to improve the neural networks. The goal is to increase the proportion of correctly classified peatland areas (true positives), while reducing misclassifications (false positives and false negatives).
These improvements are essential for developing reliable tools to support better land use decisions and protect vulnerable peatland ecosystems.